Introduction
This article will explore and explain some first principles of capital structure and how capital structure impacts returns. In many conversations with (junior & senior) finance professionals, we have heard “leverage” referred to as a cure-all.
- “Leverage will help with that.”
- “Let’s add some leverage and juice the returns.”
We want to help you develop a better intuition for capital structure and how leverage really works.
What is capital structure?
Capital structure is the sum of all the different types of capital supplied to a particular asset or company. Capital just means financing. Where is the money coming from - and in what form? For example, if you buy a house with a mortgage and some cash down, the house’s capital structure consists of the mortgage (debt) and your cash down (equity).
The same logic applies to companies. Let’s look at a few examples:
Early-stage Software Company
It’s a startup, baby! (100% Equity)
Early-stage software companies are usually financed entirely with equity (no debt). The equity, however, may be broken into multiple tranches (e.g., preferred vs. common), some with priority over others.
Industrial Manufacturing Company
Plain Vanilla Co
An industrial company could support some debt in addition to equity. Where it sources that debt from depends on the size of the company. Smaller companies might get a secured loan from a regional bank. Larger companies might tap the capital markets (and an investment bank) to raise public debt.
Ocean Shipping Company
Fixed Assets with Resale Value
A shipping company might have equity stakes in multiple large ships. These ships will be financed partially with secured debt (the debt has recourse on particular ships, like a mortgage). In addition, the shipping company might have unsecured, company-level debt. The company is also financed with equity.
These are just a few examples.
Capital structure varies greatly across - and within - industries
For this article, we are not going to focus on specific types of capital (e.g., secured debt, bonds, preferred equity, etc.). These are just labels that have evolved by convention to define certain scenarios. The more important takeaway is that capital structure and specific forms of capital vary greatly and are only limited by two factors:
- Human ingenuity
- The market’s willingness to fund a particular instrument / opportunity (at a given price)
Why does capital structure vary?
First, there are industry norms and company life cycle considerations.
Industry Norms
Industry characteristics have a major impact on capital structure. Below are a few example factors:
- How capital-intensive is the industry? Some industries (e.g., real estate, natural resources) require lots of capital.
- Do companies have fixed assets? Fixed assets offer a measure of safety / security to investors.
- How predictable is the revenue?
- How does the industry fair in a downturn? Resilient revenue is always a plus.
All these factors (and more) help define capital structure norms for a given industry.
Company Life Cycle
A company’s life stage can play an important role as well. For example, a startup will not be able to raise institutional debt. Smaller, younger enterprises are inherently riskier and unproven, and therefore, only certain providers of capital have appetite to fund them.
On the other hand, mature enterprises will not seek venture capital and other expensive forms of capital, because they have access to cheaper sources, such as public equity and debt markets.
Strategy & Management
Finally, different management teams will pursue different capital structures as part of their overall strategy. So even within a homogenous industry, capital structure varies.
First Principles
Now, let’s establish some first principles.
1. A given company can have an indefinite number of tranches of capital. There is no theoretical limit on the number of different tranches / sources of capital.
2. These tranches of capital are arranged in order of seniority (most senior to least senior).
Seniority refers to the order in which the tranches of capital are paid in a liquidity event. For example, if a company were sold, the senior debt would be paid off first, then the junior debt, then the preferred equity, and then the remaining proceeds would go to the common equity.
Therefore, the most senior tranches are least risky, and common equity is riskiest.
3. Riskier tranches of capital demand a higher return. Risk and reward are dear friends.
Investing is the art of identifying temporary dislocations in the pricing of risk. For example, if the market is pricing a certain risk higher than you think it deserves (granting it an outsized return), you can buy that opportunity and pocket the extra return.
4. Each successive tranche is riskier than preceding tranches, since each successive capital tranche is junior to the preceding tranches.
5. Therefore, each successive tranche demands a higher rate of return than preceding tranches.
Of course, the very bottom of the capital structure is common equity. It represents the claim after all other tranches (debt & equity) have been fully serviced.
Returns
Cool, enough chitchat. How does all this factor into returns?
To answer that question, let’s start with the simplest possible capital structure:
100% Equity
The company is funded entirely with uniform equity (only 1 tranche). How do we calculate the equity return?
In this instance, the Return on Equity (ROE) equals the Return on Assets (ROA). Because there’s no leverage or any other tranches. For example, if the ROA = 10%, the ROE = 10%.
The Return on Assets (ROA) is the unlevered return to the enterprise. You can calculate it as the company’s unlevered cashflow / net operating assets (total assets, but accounting for items like negative net working capital).
Note: there are many variations on how to precisely calculate the ROA and what the proper numerator (in the fraction) is. For this conversation, these variations are not important. You just need to understand that it represents the unlevered return on the company’s assets.
Okay, let’s add some leverage.
50% Debt, 50% Equity
In this scenario, let’s assume the following:
- ROA = 10%
- 50% debt, 50% equity
- 100 total invested capital
- 5% tax-effected cost of debt
What’s the return to shareholders (ROE)?
Total ROA: 10 (10% x 100)
Cost of debt: 2.5 (5% x 50)
Return to shareholders: 7.5 / 50 (15% ROE)
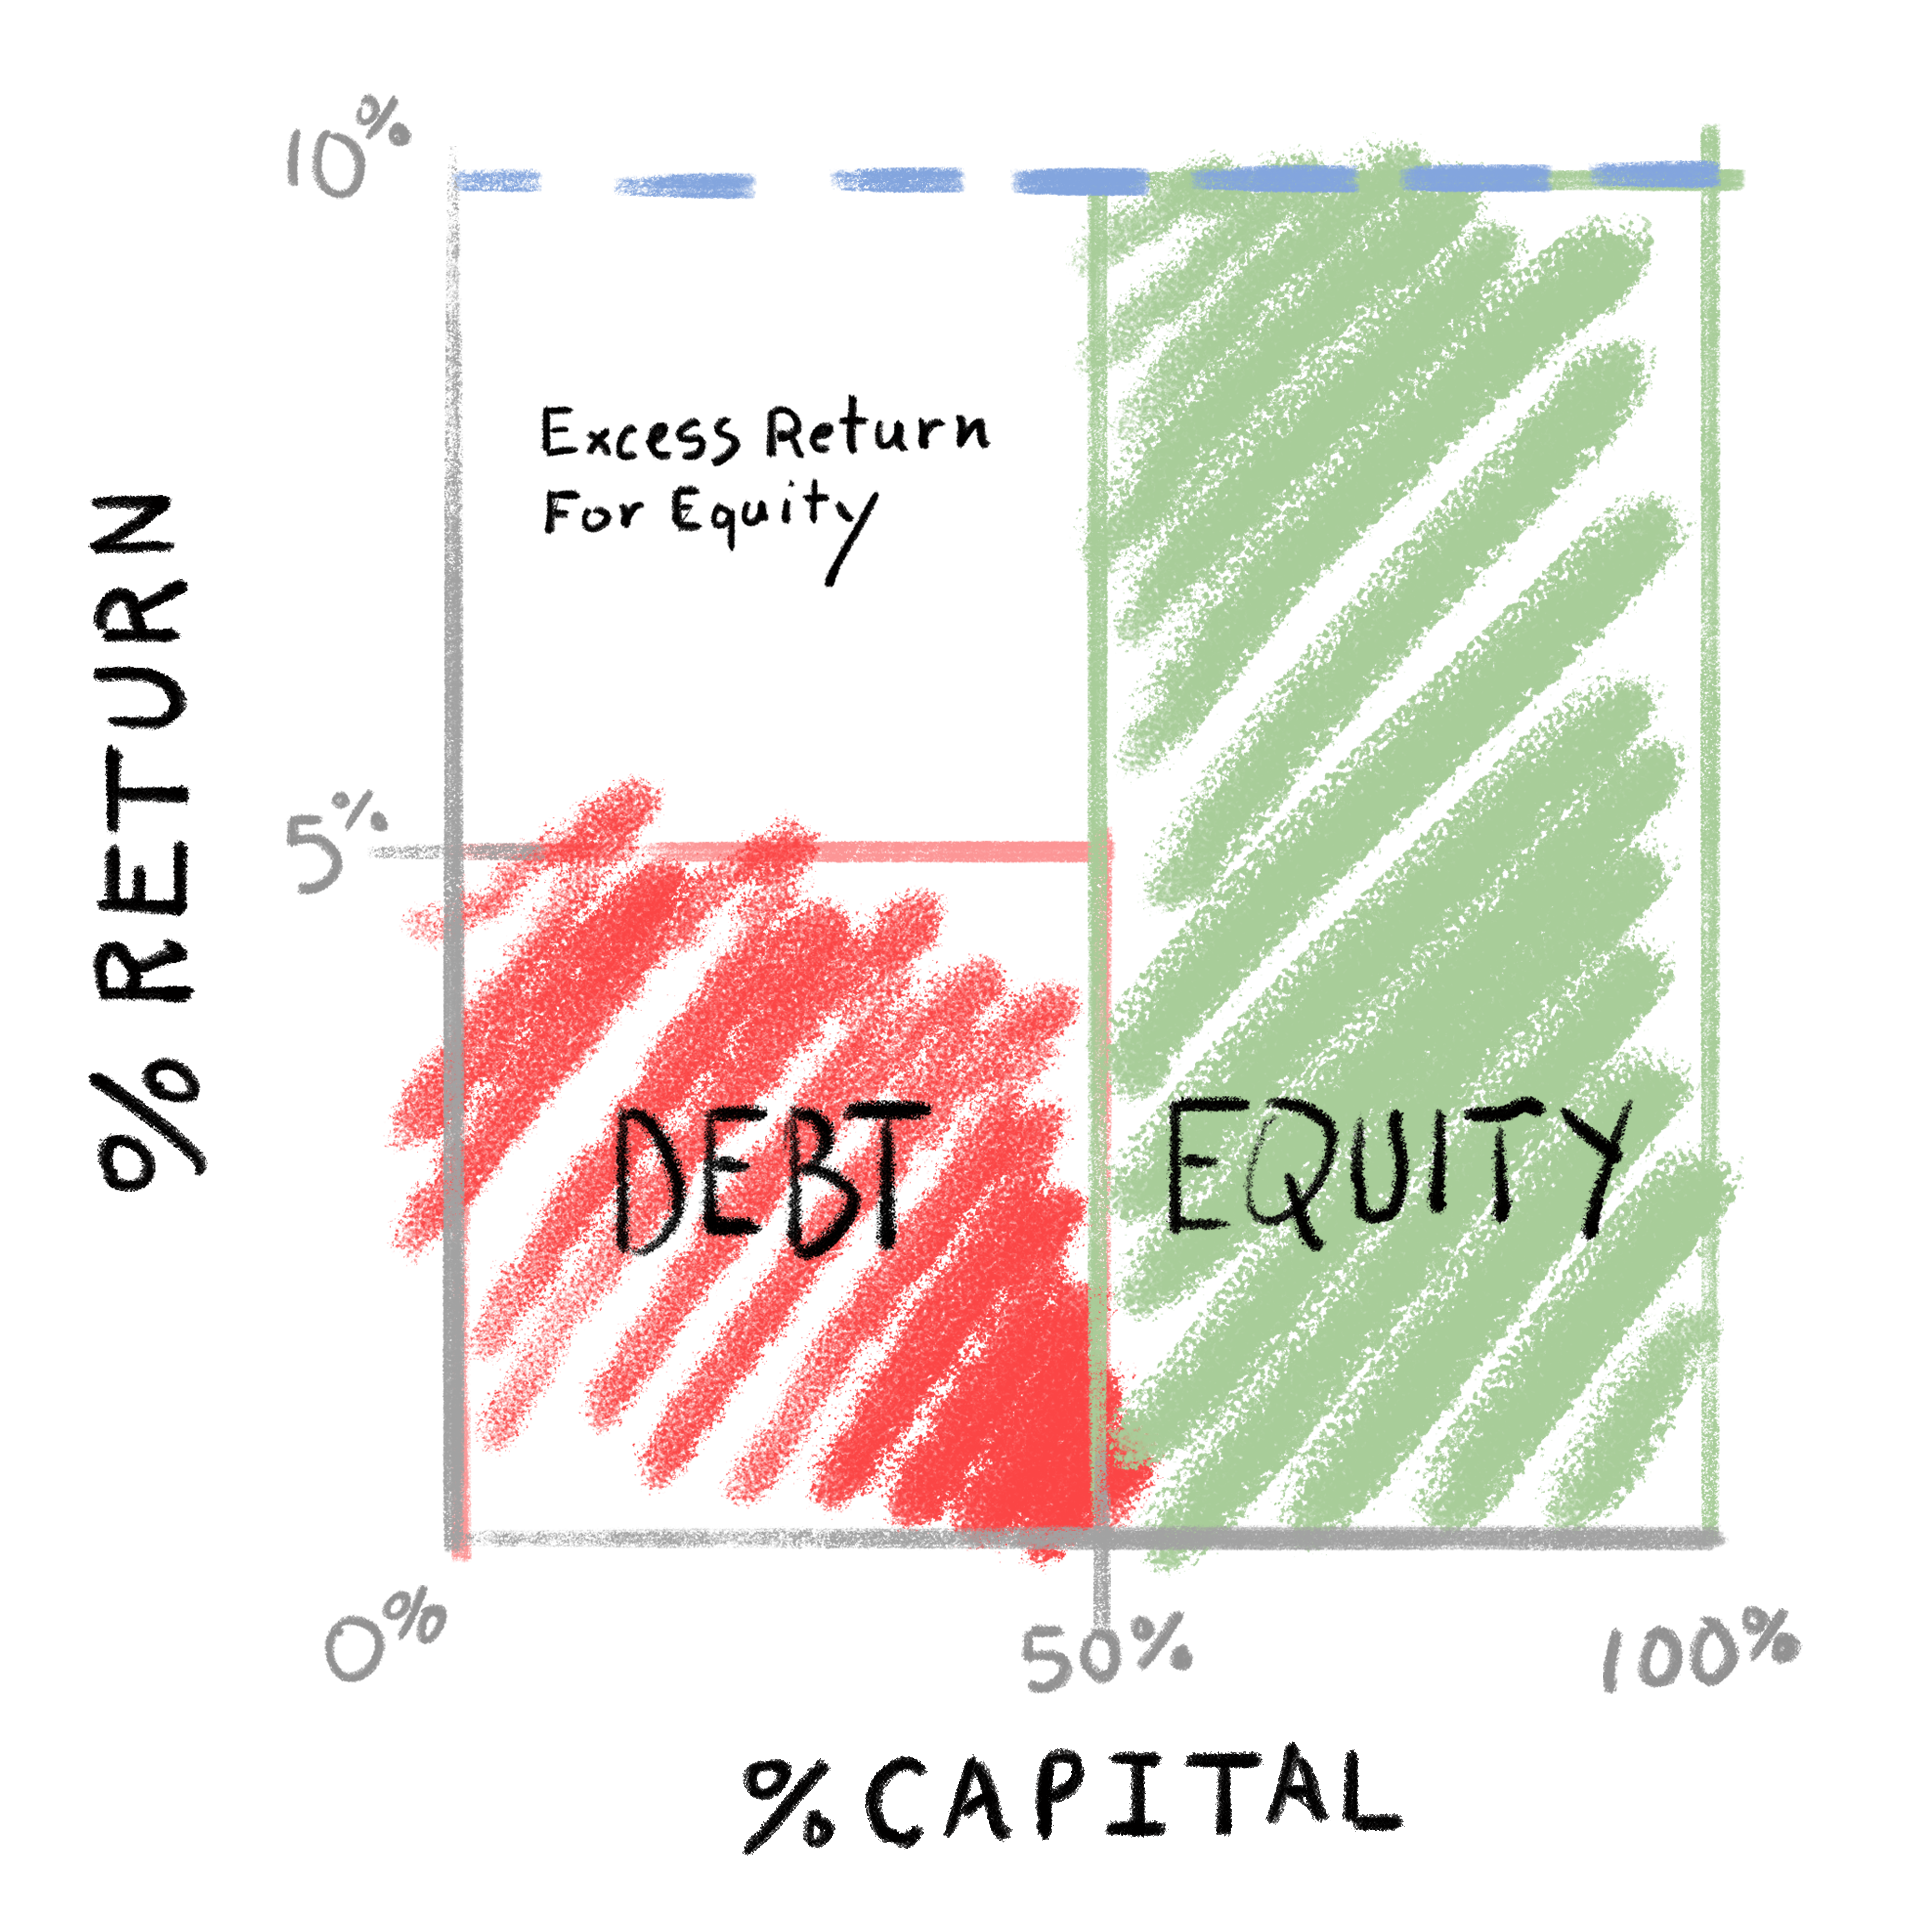
So leverage juiced the return to shareholders by 50%! I think a graphic is the most intuitive way to understand this. See our scenario below:

As you can see, equity receives the sum of:
- the ROA multiplied by the amount of equity
- all of the remaining ROA after other capital tranches have been serviced
- 10% ROA x 50 equity = 5
- (10% ROA - 5% cost of debt) x 50 debt = 2.5
ROE = 7.5 / 50 equity = 15%
Leverage, however, also increases the risk to shareholders.
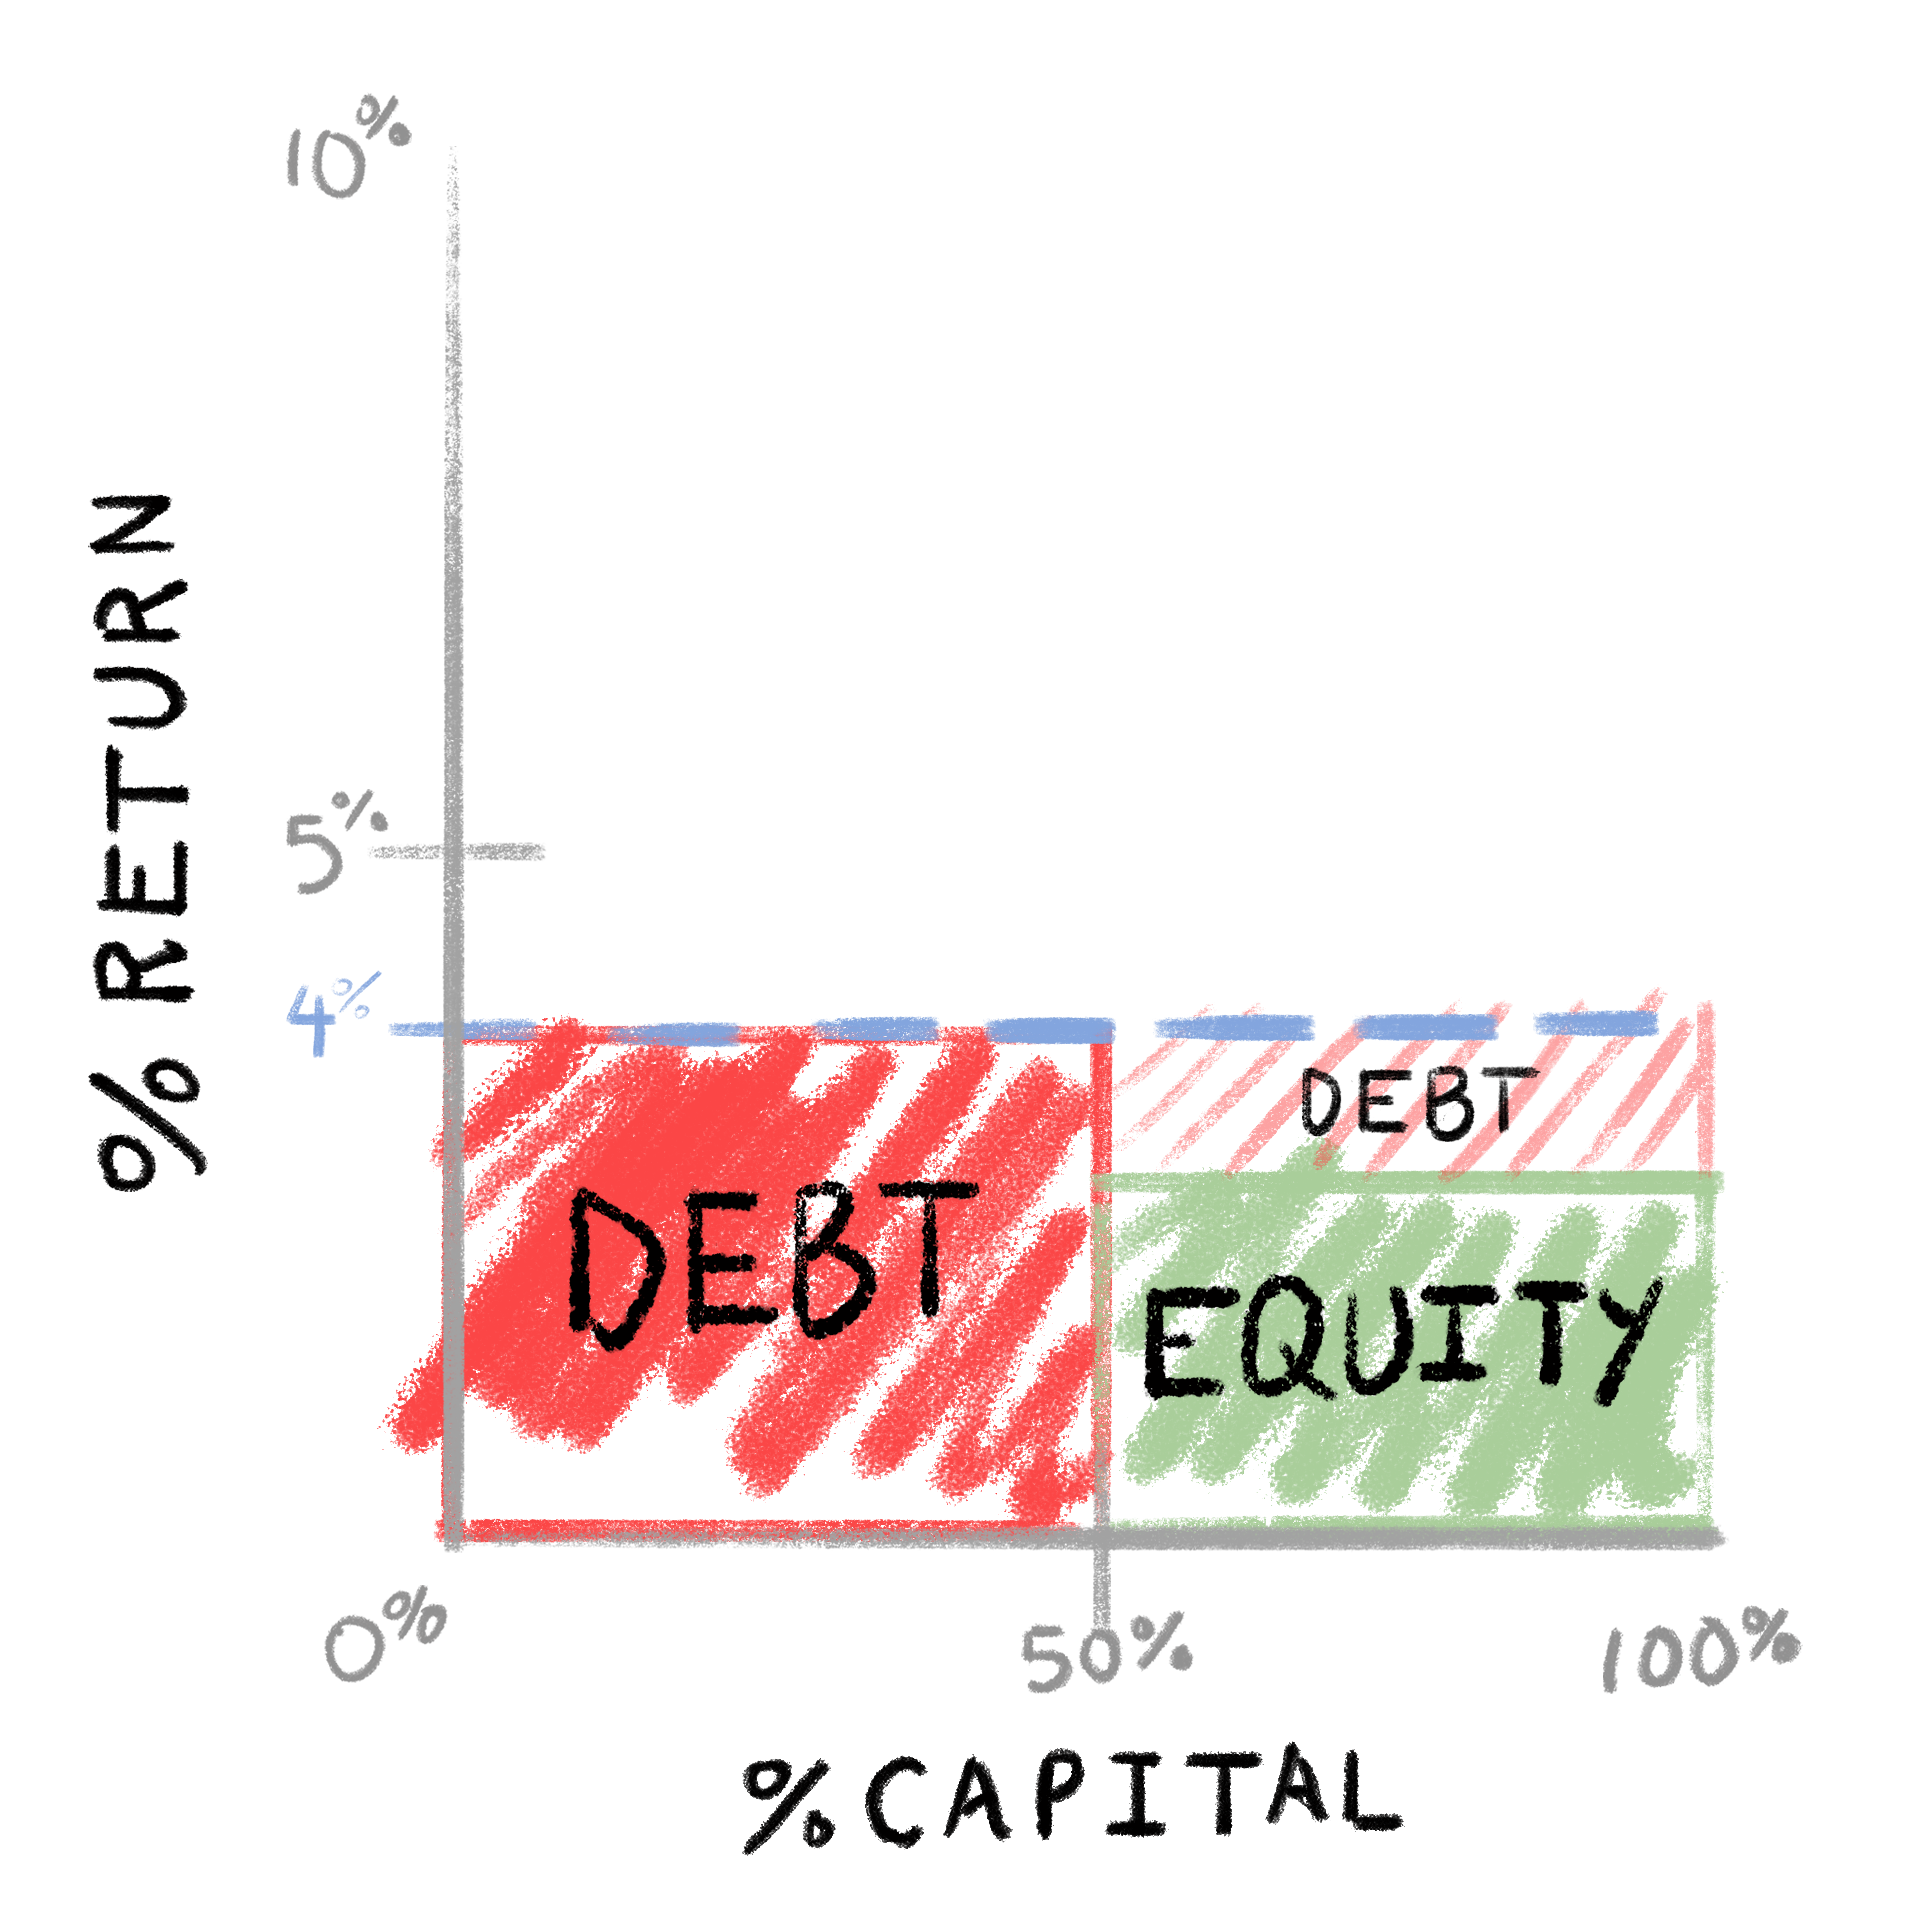
In the scenario below, where the ROA drops to 4%, equity returns dry up. Recession ain’t fun.

What’s the return to shareholders (ROE)?
Total ROA: 4 (4% x 100)
Cost of debt: 2.5 (5% x 50)
Return to shareholders: 1.5 / 50 (3% ROE)
Now, let’s examine a more complex, but realistic scenario.
35% Secured Debt, 35% Notes, 30% Equity
Let’s assume the following:
- ROA = 10%
- 35% secured debt, 35% unsecured notes, 30% equity
- 100 total invested capital
- 4% tax-effected cost of secured debt
- 8% tax-effected cost of unsecured debt
What’s the return to shareholders (ROE)?
Total ROA: 10 (10% x 100)
Cost of secured debt: 1.3 (35 x 4%)
Cost of unsecured debt: 2.6 (35 x 8%)
Return to shareholders: 6.1 (20% ROE)
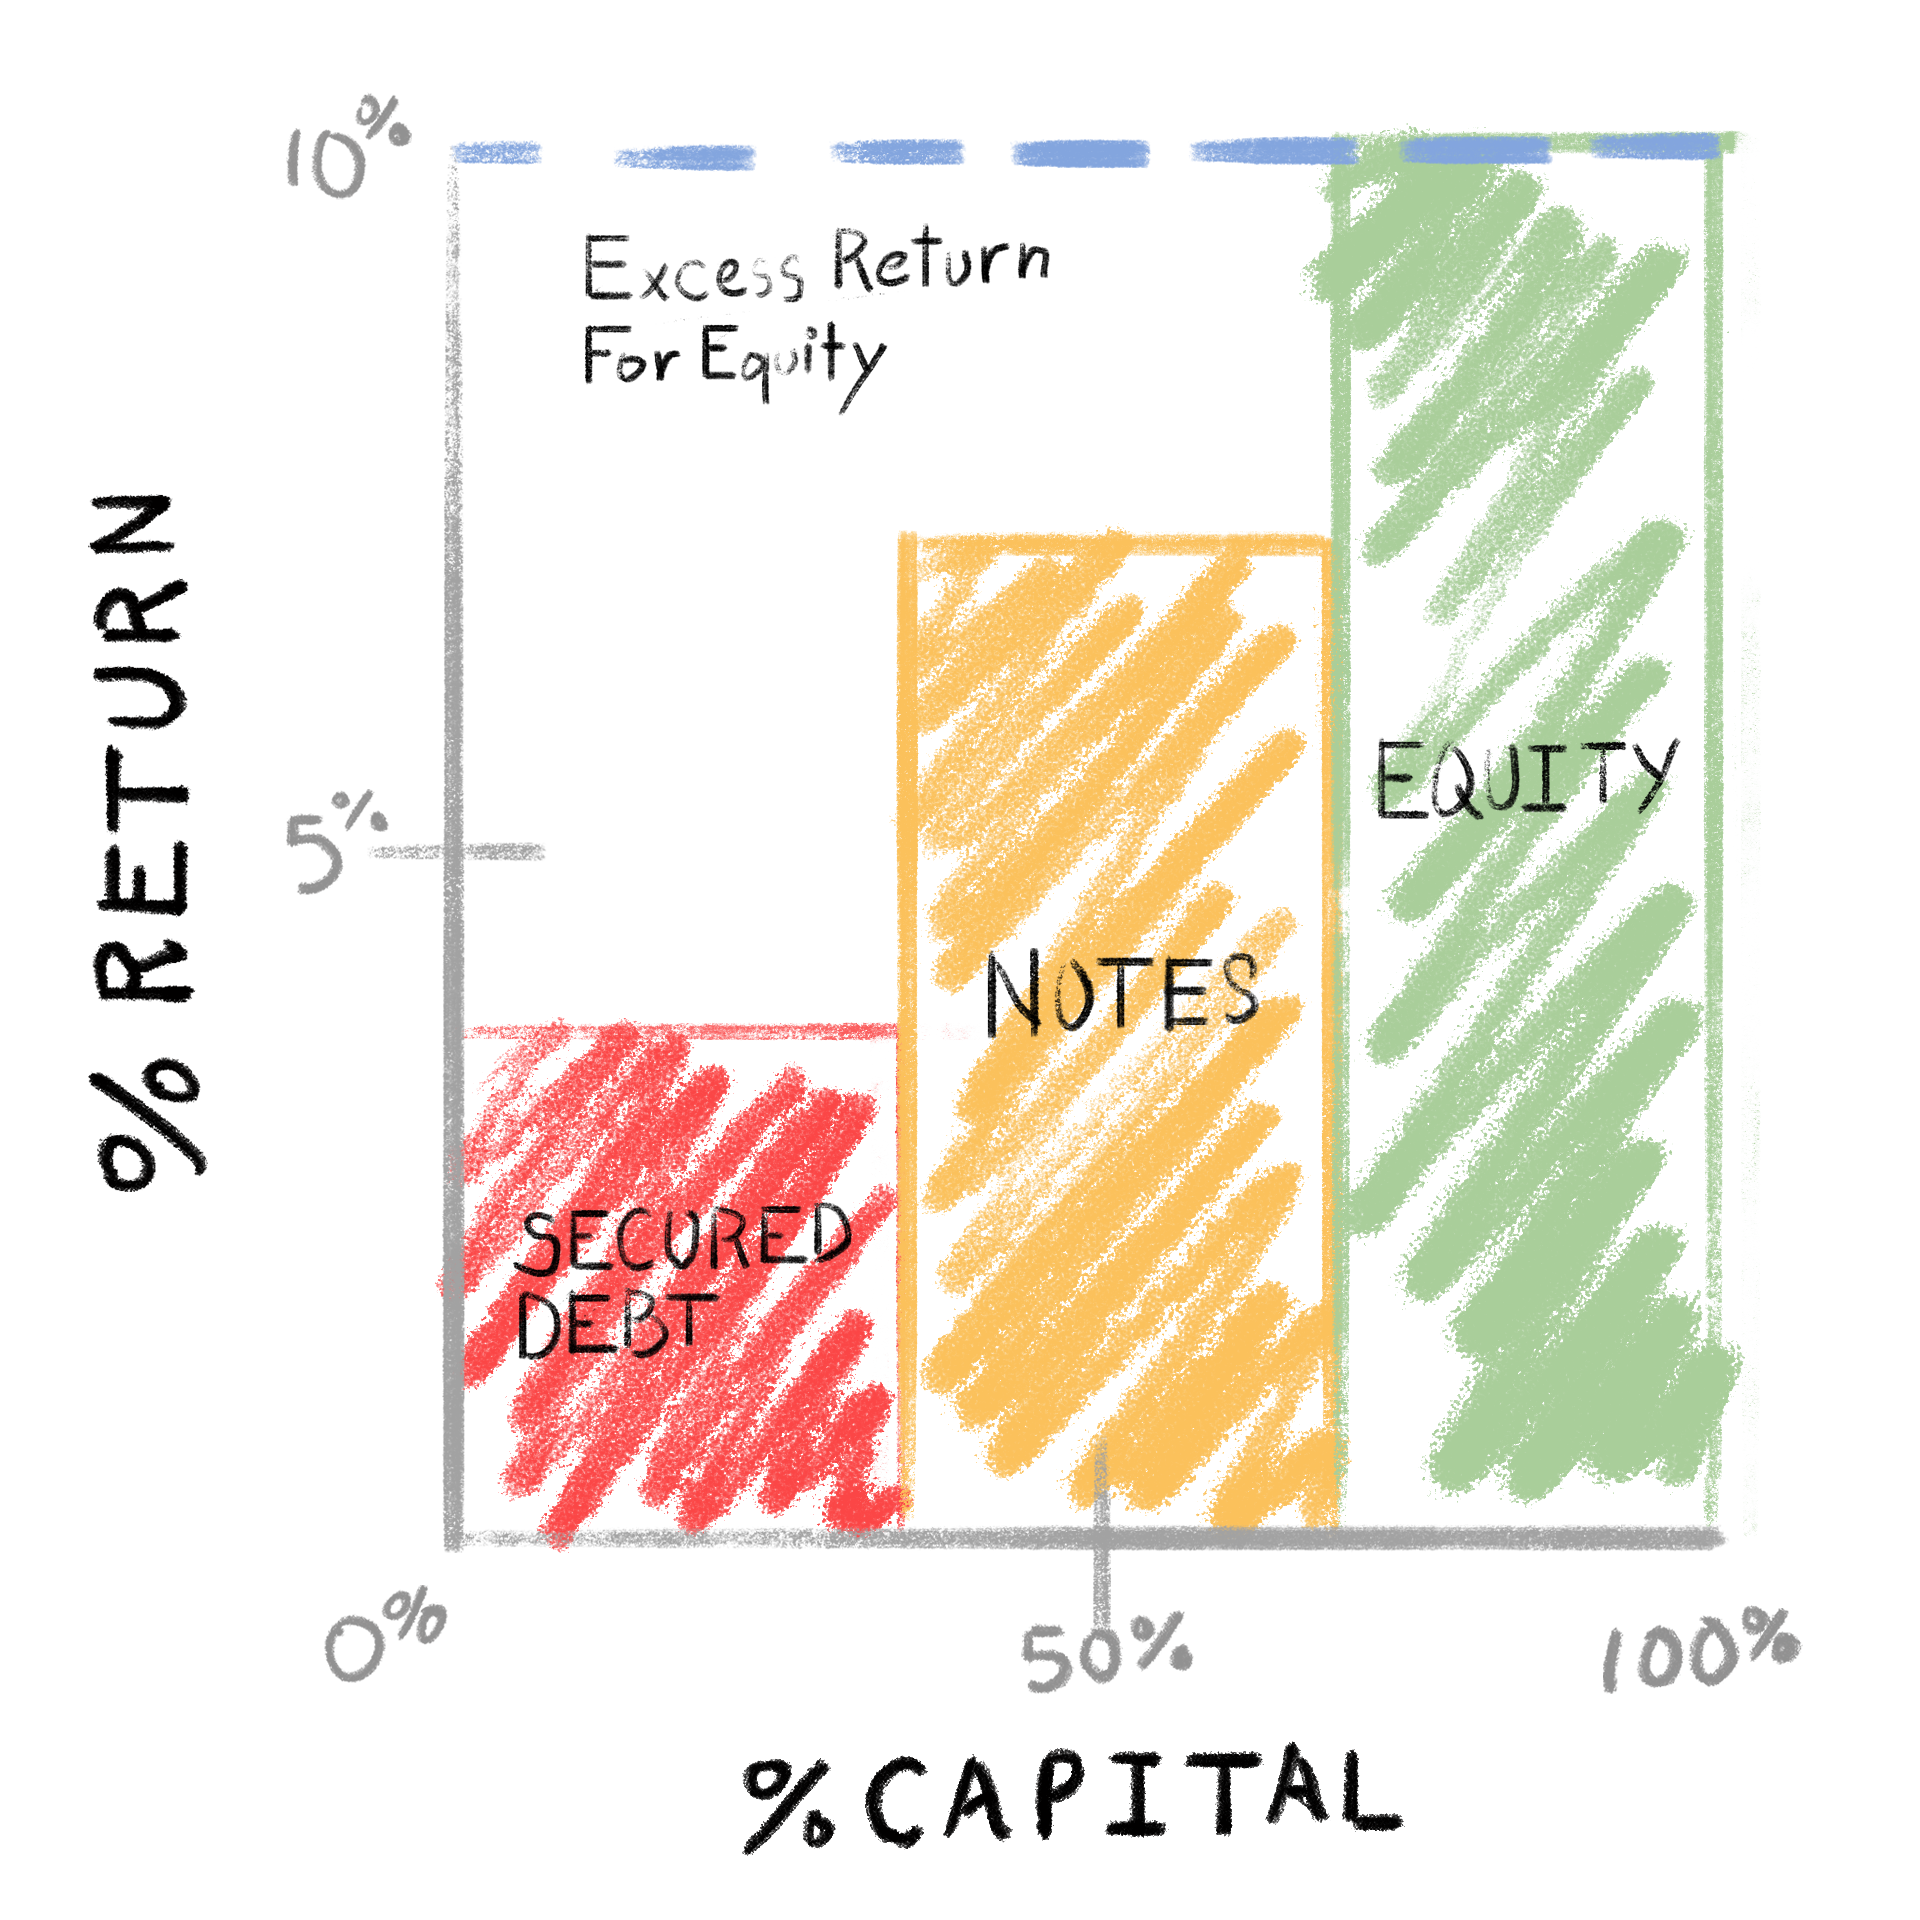
Here’s the chart:

As you can see, these leverage assumptions take an asset yielding 10% to PE-salivating equity returns. This is the magic of leverage.
This scenario also illustrates our first principles.
- We have multiple tranches of capital.
- Secured debt is most senior, then notes, and finally equity.
- Riskier tranches have a higher cost of capital.
- Each successive tranche is riskier.
- Each successive tranche is more expensive.
Other Takeaways
Leverage = Risk
We can use this logic to screen investments. For example, if we’re evaluating opportunities in a given industry and we come across two companies with similar equity return profiles, but one is more levered, choose the company with less leverage (all else being equal).
Our first principles tell us why: For a similar return, with the levered company, we would be assuming more risk. Remember - equity comes at the bottom of the capital structure.
Second Principles
The charts we’ve used to illustrate these scenarios reveal a few final principles:
1. If the cost of incremental capital is less than the ROA, the incremental capital will increase the ROE - and, of course, the risk to common equity.
We can see this clearly from the third chart. Common equity receives the surplus region between the ROA and the cost of capital for all other tranches.
2. Conversely, leverage will only hurt the ROE once the ROA drops below the cost of capital for one of the preceding tranches.
Therefore, it is in shareholders’ best interest for companies to raise debt and buyback shares as long as the cost of debt is significantly below the ROA (i.e., even in a recession, the ROA wouldn’t dip below the cost of debt).
3. Lastly, a company should not raise capital, when the cost of capital exceeds the ROA. Such financing would decrease the return to shareholders (ROE).
Note: One potential exception to these principles would be a company raising outsized debt in order to fund a transaction - and then paying off the debt ASAP. In some LBOs, the sponsors have been quite aggressive and raised expensive debt with the goal of paying it down or refinancing it within the first few years. Obviously, this greatly increases the risk as well.