Introduction
This post will be a quickie explaining mid-year discounting (a.k.a. mid-year convention). We introduced this concept in our DCF tutorial, but we’re going to fully explore / explain it below.
But why? Who cares?
- Mid-year discounting is standard practice for investment bankers.
- Furthermore, by learning about mid-year discounting, you improve your understanding of valuation.
So yeah… it’s important and useful.
Background
Let’s review some background info (bare with me). DCF stands for Discounted Cash Flow analysis. It refers to the common valuation methodology of projecting an asset’s cash flows and then discounting those cash flows to present value. Theoretically, the asset’s value equals the sum of those discounted cash flows. So far so good? If not, this article might not be the right starting place for you.
Remember - each period’s cash flows are discounted by the corresponding time period. For example, let’s assume we’re evaluating RandomCo.
- Over the next year (T = 1), RandomCo is projected to earn 100mm in cash (CF1).
- The following year (T = 2), RandomCo is projected to earn 110mm in cash (CF2).
- The following year (T = 3), RandomCo is projected to earn 120mm in cash (CF3).
- Etc.
We can discount those cash flows to present value using the general formula:
PV = CF / (1 + R) ^ TR is the discount rate.
Now let’s apply that formula to derive the value of RandomCo:
RandomCo value = CF1 / (1 + R)^1 + CF2 / (1 + R)^2 + CF3 / (1 + R)^3 + …
In this example, we implicitly assume that RandomCo earns its cash at the end of each time period, because we’re discounting each period’s cash flows by the full time period. But in the real world, that’s usually incorrect. Most businesses earn money throughout the year (or month or whatever time period you’re evaluating). By discounting these cash flows by the full time period, we unfairly over-discount the cash flows. Let’s look at RandomCo again:
We know that over the next year (T = 1), RandomCo is projected to earn 100mm in cash. Furthermore, we can assume that RandomCo will be earning 8.5mm of cash each month.
Yet we’re discounting all of that cash as if it were earned at year end. This is unfairly punitive, especially for cash earned in the next few months.
Mid-year Discounting
Enter mid-year discounting (a.k.a. mid-year convention).
Mid-year discounting is a simple correction for this over-discounting phenomenon. Using mid-year discounting, we treat all cash flows as if they occur at the midpoint, rather than the end, of the given time period. But in order to apply mid-year discounting, we must assume an asset’s cash flows are evenly distributed throughout the time period. For companies that have irregular or lumpy cash flows (e.g., highly seasonal businesses), mid-year convention is not a good fit.
Okay, let’s apply this to RandomCo:
RandomCo value = CF1 / (1 + R)^0.5 + CF2 / (1 + R)^1.5 + CF3 / (1 + R)^2.5 + …
We’re subtracting 0.5 from each time period, because we’re applying mid-year convention, and we’re treating the cash flows as if they are earned at the midpoint of each period (mid-year).
Is mid-year convention appropriate here?
Yes, RandomCo is projected to earn an equal amount of cash each month. Therefore, using the period’s midpoint for discounting is reasonable. Roughly half the cash flows will be over-discounted (months before the midpoint), and roughly half the cash flows will be under-discounted (months after the midpoint). The “misses” on both sides cancel each other out.
Mid-year discounting is not perfect, but in many cases, it captures economic reality better than period-end discounting.
A Little More Theory
Most discussions of mid-year discounting skip straight to Excel at this point. But there’s still some gold to extract.
Time Period
First, it’s important to note that mid-year discounting has a bigger valuation impact when the time period is longer. For example, mid-year discounting will have a larger impact on an annual DCF than on a quarterly DCF.
Theoretically, as we shrink the time period (from years… to months… to days), the potential over-discounting (which mid-year convention corrects for) converges to zero. Likewise, the difference between mid-year discounting and period-end discounting also converges to zero. So when we’re evaluating shorter time periods, mid-year discounting has a smaller valuation impact.
Business Model
Most bankers apply mid-year convention by default, and it’s generally a fair assumption: Many businesses earn cash semi-evenly throughout the year.
You should, however, think critically about the given business. How much seasonality does it have? For example, some specialty retailers do the bulk of their business at year end. For companies like these, mid-year convention is inappropriate - and period-end discounting is, in fact, better.
Impact
How much does mid-year convention really matter?
To answer this question, we’re going to return to our DCF template. Our template contains a switch (at the top) to turn on / off mid-year discounting. This switch will allow us to test the valuation impact of mid-year convention.
Our DCF template fully incorporates mid-year discounting, and you can review the template to examine formulas. If you have questions on specific formulas, check out our DCF article, which walks through the trickiest parts. If you still have questions after reading the article, please reach out.
Before getting into the numbers, we have a question to ponder: Under what conditions will mid-year convention have the largest valuation impact?
First off, by “valuation impact” we mean the difference in value between a DCF using period-end discounting and a DCF using mid-year convention.
Longer Time Period = Bigger Impact
We already gave you this one. Mid-year convention has a lower impact when evaluating shorter time periods, and conversely, it has a bigger impact when evaluating longer time periods.
Bigger Discount Rate = Bigger Impact
A higher discount rate will lead to a larger impact. It should be pretty intuitive that the higher the discount rate, the higher the impact of extra discounting.
Now, Some Numbers
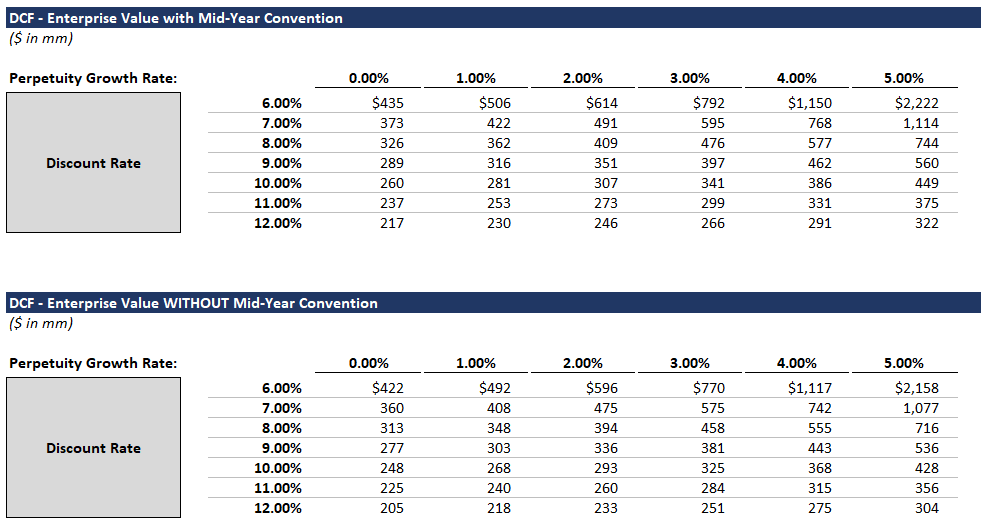
Below is a comparison of enterprise values calculated using the perpetuity growth method - with and without mid-year discounting. We calculated these values using our DCF template and an Excel data table (I know, I know - we should have been classier and made our data table the right way).

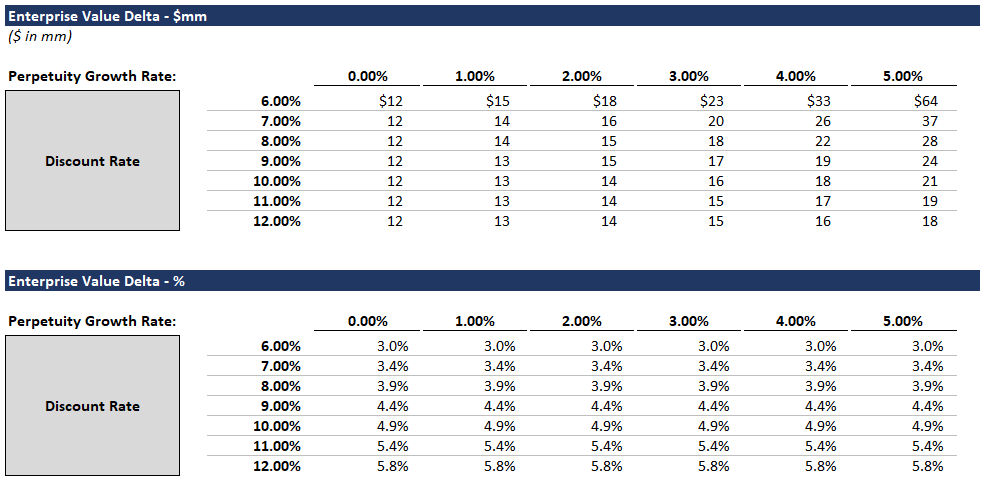
These enterprise values seem pretty similar, so let’s look at them on a percentage basis:

(Here’s the Excel backup if you’re curious.)
Takeaways
- A 3 - 6% increase in value is meaningful. For a billion dollar company, that means an extra 30mm - 60mm.
- Obviously, the details of this particular DCF are contrived, but the impact is real.
Conclusion
You should now fully understand what mid-year convention is and when and why it’s used. If in the future, your VP asks you to apply mid-year discounting to a highly seasonal business, you can politely point out that mid-year discounting might not be appropriate (just kidding - maybe skip that part).
Remember it’s important to think critically about both explicit and implicit valuation assumptions.