1. Introduction
We’re going to walk through a simple LBO model - it is not meant to be comprehensive. This model (and post) has the following objectives:
To teach core concepts and help you develop the understanding required to digest larger models. You can find a more advanced LBO modeling guide here.
To help you prepare for paper LBO tests.
Paper LBO
Often in PE interviews, in addition to a full-blown Excel modeling test, interviewers will grill candidates on LBO mechanics in person. You may have to calculate simplified debt paydown and returns calculations by hand. These are called “paper LBOs.”Here’s an example paper LBO.
Enough philosophizing, let’s get started. Here’s a blank copy of the model, and here’s a completed version with a new tab for each incremental step.
2. Core Assumptions
We tried to keep things as simple as possible, while still giving you a framework for more complex models. Below are the provided assumptions:
Financials
- LTM Adj. EBITDA: $100mm
- Annual EBITDA Growth: 6%
- Annual CapEx: $30mm
- Annual D&A: $25mm
- Annual Increase in NWC: $4mm
- Annual Tax Rate: 30%
Transaction Assumptions
- Cash-free, debt-free: the company is sold with no debt and no excess cash. This is a common assumption.
- Transaction Multiple: 9x
- Transaction Expenses: $30mm
Financing
- Term Loan: 3x Leverage, 4% interest rate, 1% annual amort.
- Senior Notes: 3x Leverage, 8% interest rate
The assumptions under Financials are the bare-minimum required to calculate free cash flow. Under Transaction Assumptions and Financing we have enough information to determine the transaction structure.
3. Transaction
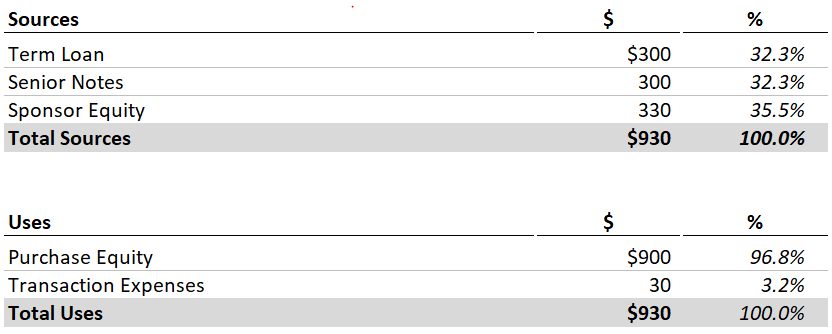
The Sources & Uses section is one of the first steps in every LBO. Quite literally it represents the sources and uses of cash - where is the buyer getting the money from, and what precisely are they using it for?
Let’s start with the Sources.
- Since we know the leverage multiples for the term loan and the senior notes, we can calculate the debt raised for each tranche by multiplying the respective leverage multiple by LTM Adj. EBITDA.
- We’ll come back to the sponsor equity. We’re going to use it as the plug to bridge the gap between total funds required and debt financing.
Uses
How do we get the equity purchase price? We have the LTM Adj. EBITDA and the Transaction Multiple, so we can calculate the Enterprise Value (a.k.a. the Transaction Value).
Transaction Value = LTM EBITDA x Transaction Multiple
We also know the relationship between Enterprise Value and Equity Value:
Enterprise Value = Equity Value + Net Debt
But remember: the transaction is cash-free, debt-free (net debt is $0), so the equity value equals enterprise value. Therefore, our Purchase Equity = LTM Adj. EBITDA x Transaction Multiple.
The transaction expenses are an illustrative assumption, so now we have total uses of cash.
Let’s go back to the Sources. We’ll set Sponsor Equity equal to the Total Uses - Debt. This mirrors actual deal dynamics - sponsors generally try to raise as much debt as possible. They pay for the rest.
Sponsor Equity = Total Uses - Term Loan - Senior Notes
Your Sources and Uses should look like this - check the completed model if you’re having trouble.
4. Cash Flows
Most of these line items should be familiar. Try to fill out as much as you can using the provided assumptions. You’re missing interest expense, so you can leave that out for now.
Your completed Cash Flows schedule should look like this:
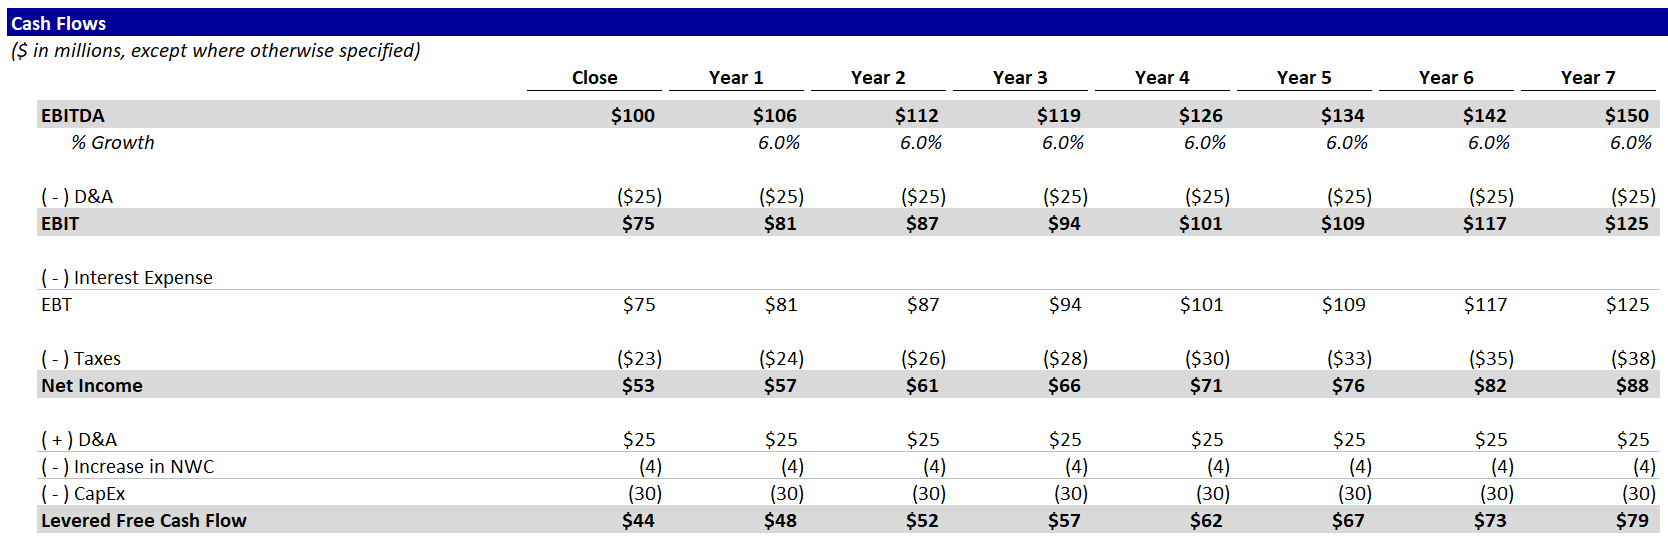
You may be wondering: Where’s revenue? Good question. Since we’re making up numbers, no need to show revenue. EBITDA feeds into Net Income and, ultimately, Levered Free Cash Flow.
Here, using detailed financials is unimportant. For private equity investors, the opposite is true. Diligencing a company’s cash flows and building a detailed operating model are among the most important parts of the investment process.
For now, let’s stick to the financial mechanics.
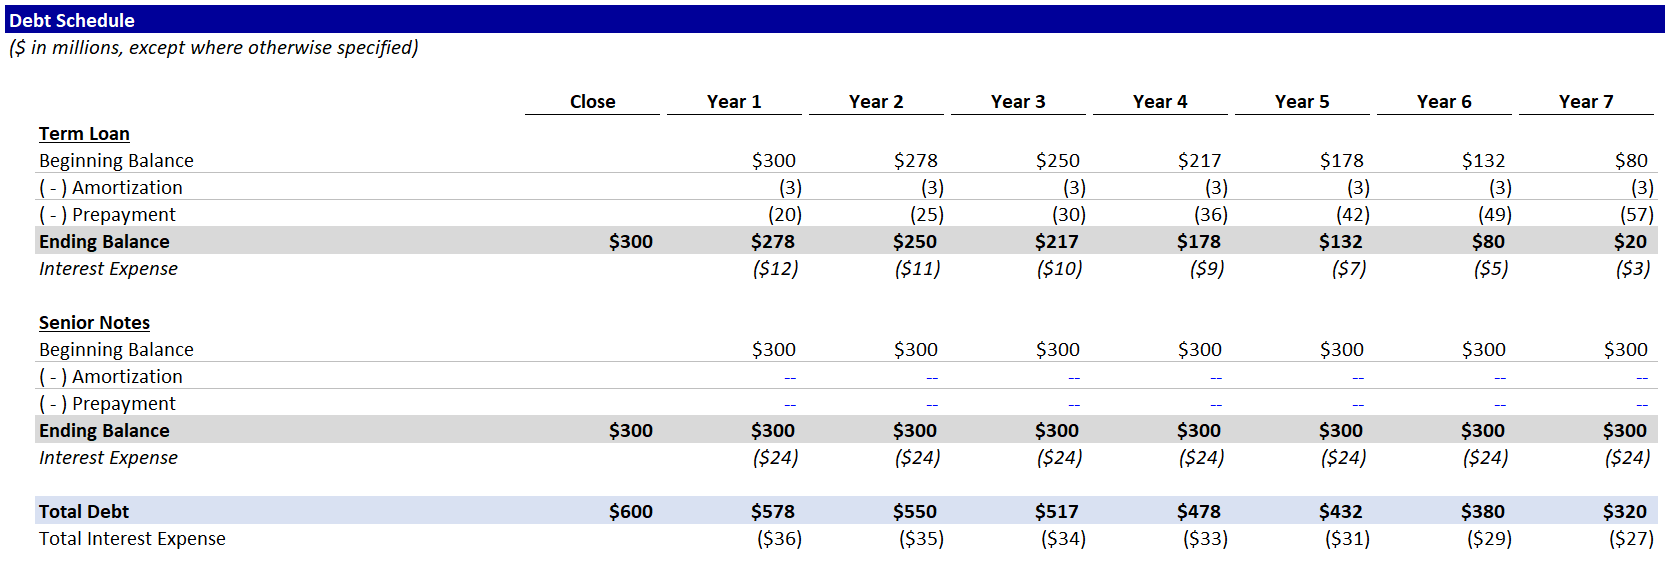
5. Debt Schedule
Term Loan
- Set the ending balance in the Closing column equal to the amount calculated in the Sources & Uses. This represents the amount outstanding immediately after the transaction closes.
- Set the beginning balance in Year 1 equal to the ending balance at close.
- Set the ending balance in Year 2 equal to the sum of the beginning balance, amortization and prepayment. Since amortization and prepayment are blank, the ending balance should equal the beginning balance. Copy these formulas across.
Ending Balance = Beginning Balance - Amortization - Prepayment.
- Go back to our assumptions. We know that the Term Loan has annual amortization of 1%. This means that the company must pay 1% of the initial loan amount to the lenders each year. Try to fill out the correct formula, but be careful - loan amortization is a percentage of the initial amount, not the beginning balance each year.
Term Loans
Term Loans are a common source of debt financing for LBO transactions. To learn more, you can check out LeveragedLoan.com. Our more advanced LBO guide includes additional resources.
5. Onto Prepayment. For illustrative purposes, let’s set prepayment equal to available cash flow each year. This is a big simplification. Ordinarily, each debt tranche would have specific rules about when and how much they can be paid back early. Why would they want to limit being paid back early? If there weren’t limits to prepayment, companies could refinance outstanding debt whenever rates decreased, and they could leave debt in place whenever rates increased. Debt investors would be hosed. The reality is that companies do this anyways, but they have to pay debt investors extra fees for prepayment, and sometimes the fees can be quite onerous. Of course, the terms of prepayment and associated fees vary greatly by type of debt and specific issuance.
Cash Available for Prepayment = Levered Free Cash Flow - Mandatory Amortization
6. As a simplification, let’s calculate interest expense using the Beginning Balance each year. Ordinarily, we would use an average of the beginning and ending balances to account for the fact that debt is being repaid over the course of the year. This leads to Excel’s dreaded circular reference, as the more advanced guide explains. Let’s keep things simple.
Interest Expense = Beginning Balance x Interest Rate
Senior Notes
Now, it’s your turn. Replicate these calculations for the Senior Notes with a couple key differences:
- Amortization is 0 in every year (you can hardcode it).
- Prepayment is also 0.
Senior Notes are one of the types of debt that usually have steep penalties for prepayment. Furthermore, the term loan is senior to the notes in the company’s capital structure, which is a fancy way of saying the term loan must be paid back first.
Total Debt
- Calculate total debt in each year as the sum of the ending balances.
- Sum the total interest expense and link it back to the Cash Flows schedule.
Other Comments
We’re not calculating a cash balance anywhere, because all excess cash flow goes to paying down the Term Loan.
Your completed Debt Schedule should look like this:
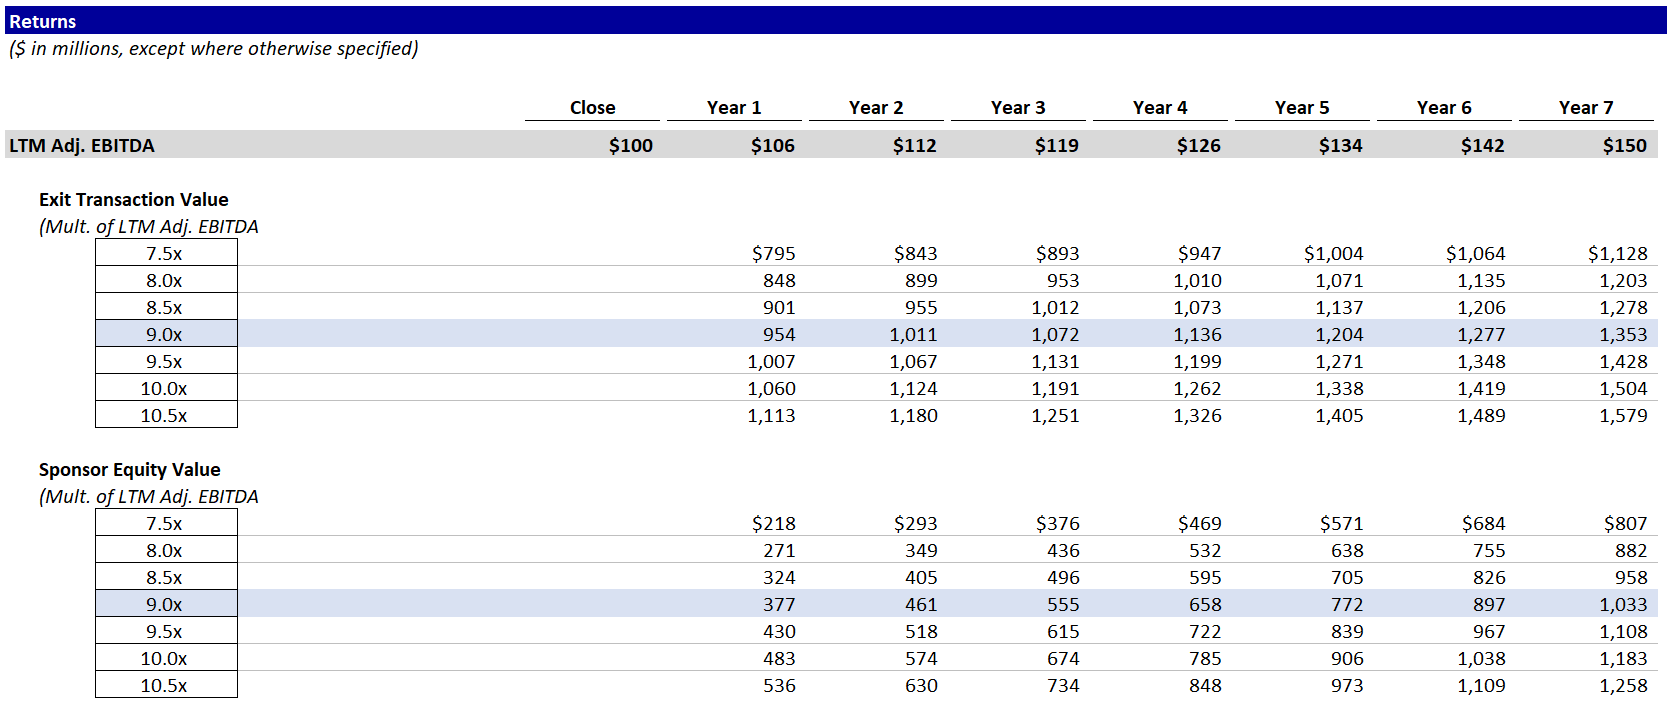
6. Returns
Now let’s find out how much money this sponsor is going to make.
- Link LTM Adj. EBITDA from the Cash Flows schedule.
- Calculate the Transaction Value at exit for each year at each multiple.
We’re showing a range of multiples, because the sponsor never knows how much they’ll sell the business for. This allows us to answer questions like - if we exit in 5 years at 7.5x, what do returns look like?
- Calculate the future equity value using the range of transaction values from the step above. We’re not building a cash balance, so Net Debt = Total Debt.
Equity Value = Transaction Value - Net Debt
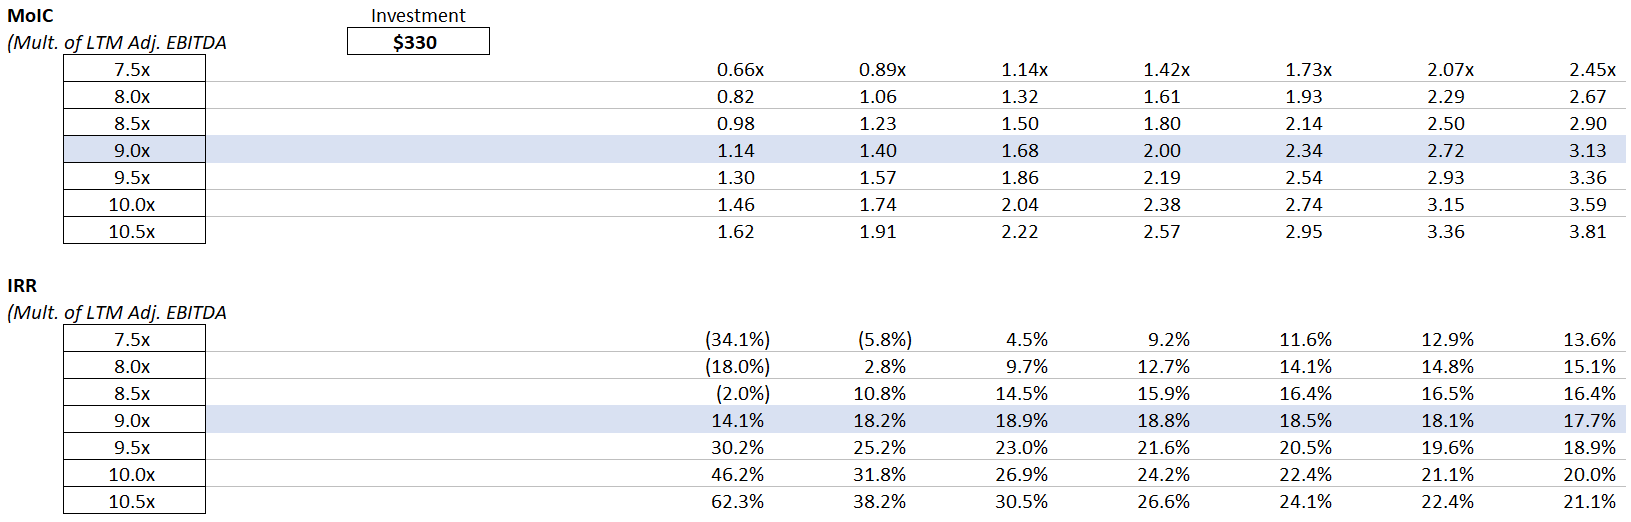
- Next up - MoIC: Multiple of Invested Capital. That’s PE speak for “how many times our money will we make?”
MoIC = Equity Value at Exit / Invested Equity
- For simple transactions like this LBO (one cash inflow and only one outflow), we can derive the IRR from the MoIC:
IRR = MoIC ^ (1 / year) - 1
IRR and MoIC are the 2 most common metrics for evaluating PE transactions. And they’re better together. MoIC makes it easy to understand the profit from a transaction, but it does not take into account the time value of money. IRR does factor in time.
Your completed returns schedule should match this:
7. Next Steps
Congrats on completing the Easy LBO! Try the rest of our private equity modeling tutorials: